Modeling and Data Processing of Information Systems
Abstract
This paper analyses data modeling and approaches for finding regularities in large sets of data, as well as their application. The applications of the presented approaches are based on data derived from a relatively large information system (University of Library Studies and Information Technologies, Sofia, Bulgaria). This paper presents models and techniques to determine optimal speed of data processing and define critical points. The results are also analyzed and discussed. At the end of the paper we provide an instance with a large sample of the real observations and all results are illustrated with examples.
Keywords: modeling, data processing, large sets of data, information system
I. INTRODUCTION
Data mining has become popular in recent years as a process of knowledge discovery from large amounts of data. These approaches are successfully used for finding patterns and regularities needed for decision-making, research, prediction and modeling data. According to IDC, the volume of data worldwide is expected to increase 44 times over the period 2009-2020 reaching the enormous amount of 35.2 zettabyte (1.8 trillion gigabytes). Although for 75% of the information in the digital world are responsible people, 80% of digital data is created by organizations. The amount of information that people create including documents, photos, music, and etc. is significantly lower than the amount of information that is created for them. The amount of information “files” or containers is growing faster than the information itself. The volume of the respective information is expected to grow eight times in the next five years while the number of IT specialists who are supposed to deal with it, will increase slightly. When searching for sources of the information system for each user (anonymously) store data on the sources from which it is interested or keywords used. Subsequently, these data are analysed using Markov model through dynamic network
Bayesian and serve to give recommendations to other users. This information filtering system allows for providing to users an appropriate source of information given the chosen preferences or keywords based on other users’ experience.
II. THEORETICAL BACKGROUND
Extracting knowledge is a non-trivial process of identifying valid, novel, potentially useful and understandable images (templates) from a given set of data. The data contain a description of the surveyed objects. In most cases, the object is determined by n - dimensional vector of ordered properties and relations between objects or between their parts can also be used. The properties can be discrete (ordered or disordered) or continuous, i.e. a subset of the real numbers. The property of an object is given by attribute and its value (color – attribute: the color is blue - property; toxicity – attribute: drug is toxic - property). Each specific object can be used for training (building on the model), or it can be applied in already built model (prediction). Building a model aims to summarize, describe and predict a certain amount of data. The model allows for classifying, regressing, data visualization or finding patterns and regularities and identifying common characteristics of a group of objects. The discovery of templates requires the definition of the term “template” or “common image”. Templates can be represented by relations. Classification tasks seek the relations between objects in a given area and the respective classes (classes’ markers). Regression tasks seek the correspondence between objects and values set in a metric space (e.g. continuously), or values of a function. The goal is set as follows given multiple data D = {(x 1 , y 1 ), (x 2 , y 2 ),…, (x k , y k ) }, which is generated by an unknown function f = x → y, to find function f’ = x → y, such that f’ approximates f. Each object from D is defined as a vector x =( x1x2,…xn,) , where xj corresponds to the particular property.
The classification methods (neural networks, nonlinear statistics) can be modeled by using generalized discriminatory functions. Examples are as follows [10]:
Polynomials ( ) … , 0 1 2 1 2 >= j r d r r r f x x x x r d Random basis function ( ) exp(| | / ). 2 2 r rr f x x x σ = −
There are methods for classification by nonlinear transformation of the original data into another space with higher dimension where the objects are linearly separable (Support Vector Machines, Self-Organizing Maps, Radial Basis Networks, Statistical Learning Theory) [10], but they now rarely used.
III. OPENING TEMPLATE DATASETS
For this purpose is used a probability approach. The set of data is divided into groups. Located parameters that provide maximum difference between probability densities groups. • Data properties are incomplete. The objective is to construct a model of the desired properties, the data for which were obtained by experimental measurement. The choice of a parameter that results in the best separation between the two groups is made based on an evaluation of the probability density of each group and comparing them. [10] Let is given a set of variant objects М={S1 , S2 , …Sn}, and a set of classes ω={ω1,…, ωk Let’s denote by x arbitrary property of the object S, such that x ∈ R. We seek the probability of belonging to the class ωi, under certain values of x for the object Si = (gi, di, zi). According to Bayesian formula we have (1): ( ) ( ) ( ) /( / ) p x p p xp x i i i ωω ω = . (1) Assuming that the classes ωi are equally possible, it only remains unknown probability p (x|ωi). Assessment of the probability density p means the finding of a suitable function f(x), which describes the available data. In this task, there are no reasons for choosing a particular type of function, so can be applied non-parametric method [10] to assess the probability density. To classify an object x=(x1,…,xN), means that defined their assigned duty belonging to one of the possible classes. Let d(x) is a rule of decision that determines which of the possible class c class belongs site: : , { , ,…, }. 0 1 c nd R ω ω ω →Ω Ω= Thus, d(x) is defined as a function. We will use the symbol d(x) = wi, to indicate that x is classified to class ωi. For cases when you can not decide introduced special class ω0. The rule of Bayesian decision-making is a theoretical optimum quality classification as practical implementations can only come close to this limit [10].
Let’s look at the environment as a random generator objects with probability P(.) And the corresponding density of probability p(.) in case of continuous values. Generates a vector of values of x and its meaning (in-membership of a class ω), which are regarded as random variables. Let x be multidimensional continuous random variable, and ω is a discrete random variable. The magnitude required for classification is p(ω|x), i.e. the conditional probability of the object belonging to a class ω, provided that has properties x (posterior probability). According theorem Bayesian (1) we find p(ωi | x) where P (ω) is apriority probability of class ω and c is the number of classes. If known law (joint probability density) that is generated objects p (x, ω), this classification is trivial, otherwise use some of the rules of Bayesian [10]. As a criterion for end commonly used predefined number of parameters.
IV. CREATING MODELS DESCRIBE DATA
In this paper, we use a method that allows the extraction of the common characteristics of objects belonging to the class .. In the one-dimensional case these features are in the form of intervals of the parameters. The resulting fields can be used to further classify unknown objects [5,6]. Usually objects are described by a large number of parameters, and often there are missing values or parameters of the objects. To take account of the variety of parameters on the basis of all the received common features are built wood of the decision. Decision tree used to classify unknown objects, search the databases. For this purpose it is necessary description of the decision tree that allows: • automated decision making - the application of already established decision tree to another multiple objects through a computer program; • universality of the description - do not require the creation of a new computer program for each new problem; • intelligibility for the user - the description is in terms similar to those he works with the expert At the basis of the algorithm lies accumulation of data on the behavior of the information system. The output staging is as follows: system user is interested in a particular property, set with quantitative interval feature [1, 2, 7]. To solve the targets was developed formal language to describe the logical rules for classification and search databases [8, 9, 10]. The rules are based on user-defined conditions and are expressions of the type described limitations associated with Boolean operators. There is a possibility to assign parameter values. Thus it can be built arbitrary decision tree. The user enters certain search keywords, resulting in a displayed list of redundant data for each record. It is the user explicitly chooses an entry to be able to see all the information about it. When choosing a specific recording information that is recorded by the system. By thus providing the accumulation of information about logically interrelated records from the database. Of course, the user may mistakenly or deliberately choose to review records related to interest him subject area, but the accumulation of information about the behavior of large numbers of consumers will eliminate the importance of these fluctuations, which actually represent a deviation from normal rational behavior [3, 4, 6]. The most popular systems management databases are Access, Oracle, Paradox dBase, FoxPro, Cliper, Sybase and others.
V. APPLICATION
The applications are based on data derived from relatively large information system AGORA in the University of Library Studies and Information Technologies, Sofia, Bulgaria. It included 58725 observations. (Tab.1) containing: • х1- number of observation; • x2-name of information system; • х3- name of the form; • x4 number of user • х5- time in milliseconds; • х6-date; • x7-name of format two. Each monitoring system is defined as ordered 7 dimensional vector x =( x1x2,…x7), where xj corresponds to the particular property.
Table 1. Data based - information system AGORA
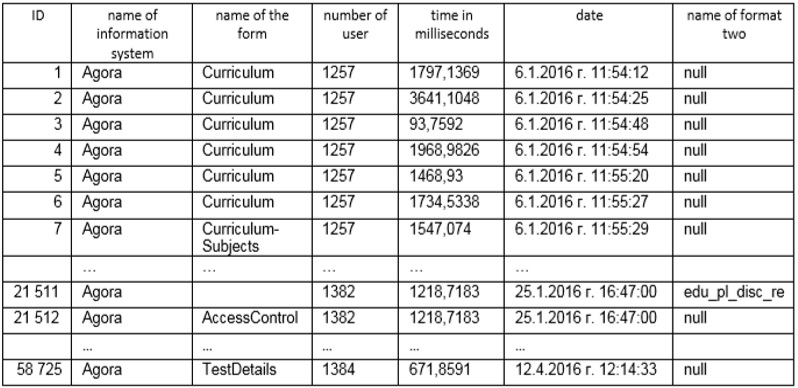
Table 1. Data based - information system AGORA
With 5 ω denote class “time in milliseconds.” For the sample we received the following features using Descriptive statistics of Data Analysis Excel (Tab.2). Calculated following numerical characteristics (estimates). Through various averages describes the most representative part of the statistical population - central tendency of all. Denote and find: S1 - max time - 33468,8341; S11 - number of observations with max time - 2; S2 - min time -15,6246 ; S21 - number of observations with min run time - 1; S3 - Mean Time - 1189,218517; S4 - number of observations in the interval [1500, 1599] – 10416 observations.
Mean 1189,218517 Standard Error 3,071093827 Median 1124,9448 Mode 578,1366 Standard Deviation 744,2255879 Sample Variance 553871,7257 Kurtosis 313,5741302 Skewness 11,50674964 Range 33453,2095 Minimum 15,6246 Maximum 33468,8341 Sum 69836857,41 Count 58725 Largest(1) 33468,8341 Smallest(1) 15,6246 Confidence Level(95,0%) 6,01935736
Table 2. Descriptive statistics of Data Analysis Excel
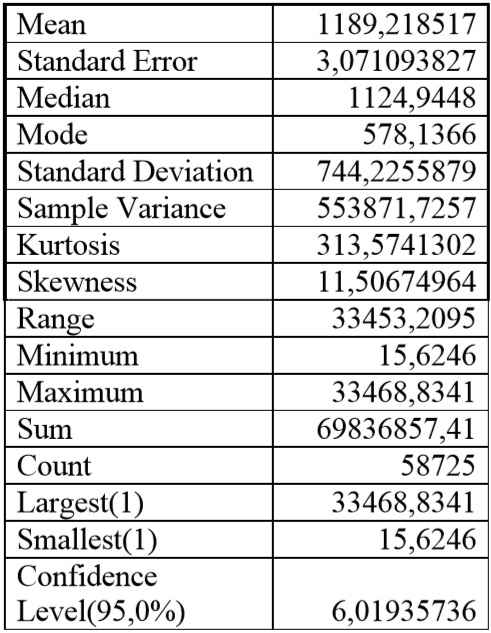
Table 2. Descriptive statistics of Data Analysis Excel
The probability particular observation to fall in the range [1500, 1600], according to the formula of Bayes and others. p(S4) = 0,177369093 We define the following intervals: [0; 999], [1000; 1999], [2000; 2999], [3000, 3999], [4000, 4999], [5000, 5999], [6000, 6999], [7000, 7999], [8000, 8999], [9000, 9999] and [10000, …]. Let d(x) is a rule of decision that determines which range from the possible 11 interval belongs site and probability to fall in the corresponding interval. See Tab.3 and Fig.1.
interval count propability 0-999 17371 0,295802 1000-1999 39285 0,668966 2000-2999 936 0,015939 3000-3999 699 0,011903 4000-4999 165 0,00281 5000-5999 113 0,001924 6000-6999 114 0,001941 7000-7999 69 0,001175 8000-8999 20 0,000341 9000-9999 9 0,000153 after 10000 34 0,000579
Table 3. Interval distribution
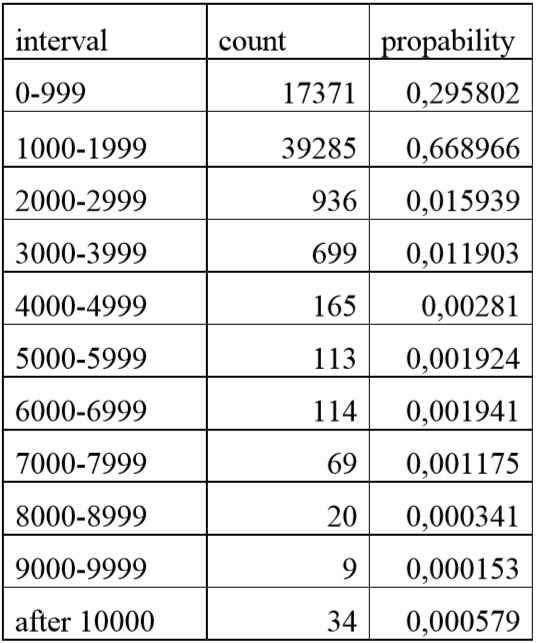
Table 3. Interval distribution
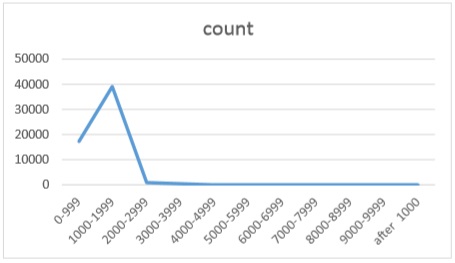
Figure 1. Interval distribution
The results show that 96% of the processing time of the data are located within the first two intervals. This allows for optimization of the system in order to improve the speed of data processing. The following table and diagram show the number of searches on user IS Agora. (Tab. 4 and Fig.2) number lookup 160 187 195 201 204 207 231 24
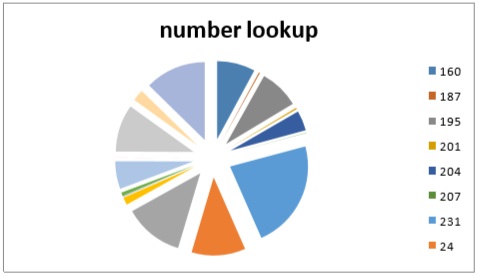
Figure 2. The number of searches on user IS Agora
Fig.2 The number of searches on user IS Agora.
Unique user ID number lookup 160 3 365 187 103 195 3 521 201 119 204 1 770 207 26 231 9 624 24 4 774 243 5 261 249 675 25 32 26 313 264 2 460 27 17 28 4 196 301 1 025 306 5 410 316 1 367
Таб.4 The number of searches on user IS Agora.
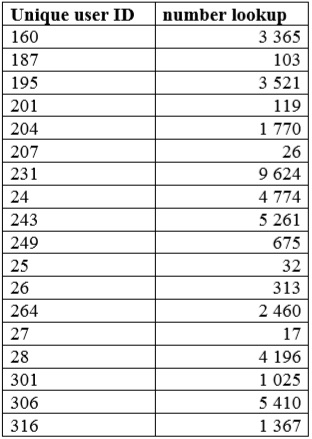
Table 4. The number of searches on user IS Agora
VI. CONCLUSION
Maintaining the high quality of the information included in the information system of UNIBIT is essential for its efficiency. Without relevant information, by its nature the process of training and research would not be sufficiently effective in this university. As a source of completing the bibliographic information in the information systems of the university libraries serve incoming information streams of each library. Depending on the key scientific fields specific to the university, incoming information streams vary widely in terms of information sources. The more sources used in scientific work of local researchers are available in the information system of the university, the more the approach of “filtering” of incoming data streams used by employees is correct. Use the possibilities of NoSQL system Redis can significantly ease the practical implementation of methods, because the built-abstract data structures, such as multiple and sorted many of Redis, greatly simplifies the implementation of such projects, while the final storage of the data structure hash of sorted sets is optimized for fast response regarding the appearance of advice to consumers.
ACKNOWLEDGMENT
This work is partly supported by the project SIP-2016-09 “Creation and investigation of mathematical models with intelligent applications”.
REFERENCES
[1] Georgi P. Dimitrov, Galina Panayotova, Queuing systems in insurance companies – analyzing incoming requests,Proceedings in Electronic International Interdisciplinary Conference,The 2nd Electronic International Interdisciplinary Conference,EIIC 2013,2. – 6. September 2013,Slovak Republic, ISBN 978-80-554-0762-3,ISSN 1338-7871,p. 139-142
[2] Galina Panayotova, Georgi P. Dimitrov, Researching and Modeling of Queuing Systems of the Insurance Company HASSACC - HASSACC - HUMAN AND SOCIAL SCIENCES AT THE COMMON CONFERENCE,HASSACC 2013 - Virtual Conference Human And Social Sciences at the Common Conference,18-22 November, 2013, ISBN: 978-80-554-0808-8 ISSN: 1339-522X, p. 93-95
[3] Georgi P. Dimitrov, Ilian Iliev, Study of methods for front-end webpage optimisation The 3rd International Virtual Conference 2014 (ICTIC 2014) Slovakia, March 24 - 28, 2014,
[4] Georgi P. Dimitrov,. Ilian Iliev, Front-end optimization methods and their effect, MIPRO 2014 - 37th International Convention, 2630.06.2014
[5] Georgi P. Dimitrov,. Galina Panayotova, Stefkka Petrowa, Analysis of the Probabilities for Processing Incoming Requests in Public LibrariesThe 2 nd Global Virtual Conference 2014 (GV-CONF 2014) Goce Delchev University Macedonia & THOMSON Ltd. Slovakia, April 7 - 11, 2014,ISSN: 1339-2778
[6] Georgi P. Dimitrov, Galina Panayotova, ANALYSIS OF THE QUERING OF DATABASES IN SYSTEMS FOR QUALITY MANAGEMENT OF EDUCATION, Macedonia, 12th International Conference on Informatics and Information Technologies, 04.2015, Bitola, Macedonia
[7] Galina Panayotova, Georgi Dimitrov, Balancing Automated and Manual Testing with Opportunity Cost, the 4th International Virtual Conference 2015 , (ICTIC 2015) Slovakia, March 23 - 27, 2015
[8] Georgi P. Dimitrov, Galina Panayotova, “ASPECTS OF WEBSITE OPTIMIZATION”, PROCEEDINGS OF THE UNION OF SCIENTISTS – RUSE VOL . 12 / 2015, 106-113, ISSN 1314-3077
[9] Galina Panayotova, Georgi P. Dimitrov, Deign of Web-Based Information system for optimizacion of portfolio, Proseding of the 13th International Symposium on Operational research SOR’15, Bled, Slovenia, 2015, pp.193-198.
[10] Silverman, B. W., Density Estimation for Statistics and Data Analysis, Chapman and Hall, 1986.